Dear Professor,
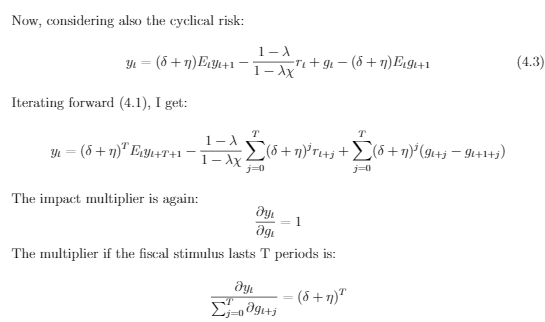
I should get the figure for the cumulative multiplier (that I computed analytically) and compare in the same figure the case when \delta + \eta <1 and the case when \delta + \eta >1. Thus, I should have in the same figure the case where for example \delta + \eta =0.90 and the case where \delta + \eta=1.10.
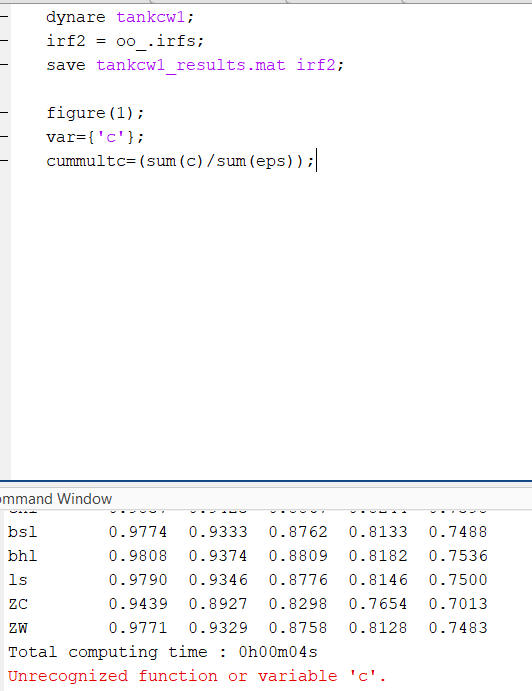
This is the first time that I need the figure for the cumulative multiplier and I really do not know the codes that I have to use…
Thank you very much