About the plot of IRF

Hi everyone.
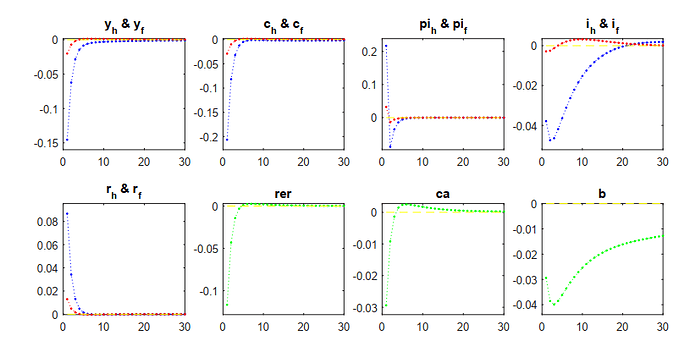
I am a green hand of dynare, and I found that many paper of DSGE can draw the picture like this:


I am interested about how to combine two IRF picture to only one picture like the above one.
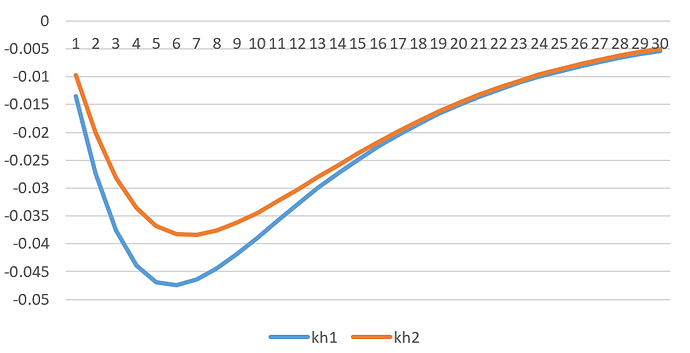
I can only draw the picture with excel, like this:

And that’s a lot of trouble to do, if I want to draw a lot of pictures.
Could someone please tell me if there is a relevant tutorial ?
Thank you very much!

I found the oo_.irfs maybe an important file of plot the picture after searching on the internet ,but my code don’t offer me the oo_.irfs.
I use MATLAB2016.
Here is the code:
nk2c0012.mod (6.9 KB)
Thank you for any advice!

Hi, maybe this thread could help you. IRF-Plotting-Guide for Beginners - #2 by DoubleBass
Basically it comes down that you do all the “fancy” plotting from Matlab and not Dynare.

Thank you very much for your suggestion and that is what I want to do.
I found the following code which makes some edition on it:
mo_02.mod (3.7 KB)
But I still feel confuse about some details of the following code:

Impa(myloop0,:)=n_e;
Impa(myloop0+2,:)=c_e;
Impa(myloop0+4,:)=i_e;
Impa(myloop0+6,:)=y_e;
Impa(myloop0+8,:)=cr_e;
Impa(myloop0+10,:)=co_e;
Impa(myloop0+12,:)=wp_e;
Impa(myloop0+14,:)=4r_e;
Impa(myloop0+16,:)=4
pip_e;

end

close all

%%%%%%%%%%%%%%%%%%%%%%%%%%%%%%%%

figure

subplot(3,3,1), plot(0:1:14,Impa(10,1:15),‘r–’,‘LineWidth’,2)
hold on
plot(0:1:14,zeros(1,15),‘k’)
title(‘Rule-of-thumb consumption’)
hold off

subplot(3,3,2), plot(0:1:14,Impa(11,1:15),‘b-’,‘LineWidth’,2)
hold on
plot(0:1:14,Impa(12,1:15),‘r–’,‘LineWidth’,2)
plot(0:1:14,zeros(1,15),‘k’)
title(‘Optimizing consumption’)
legend(‘\lambda = 0’, ‘\lambda = 0.5’)
hold off

//////////////////////////////////////////////////////////////////////////
Could you please tell me the implication of the ‘Impa’ part and the implication of the number ‘10’ in ‘Impa(10,1:15)’ ?
And how to tell the dynare code that I want the irf of lamda=0 and lamda=0.5 ? I didn’t find the corresponding part of the code.
Thanks for your reply!
I dont know what code that is but to me it looks incomplete. So it is hard to tell what Impa is, but the 10 means the 10’th row of this matrix Impa, whatever it is.

If you follow the simple sample code that I linke above you can see that you have to run Dynare for each parametrization and save the results. Than you can use these to create the plots in Matlab. So in your case, if you want to have two options, one with lambda=0 and one with lambda=0.5 you run two versions of Dynare and save the results. You can also look around the forum a bit more, there are plenty threads that cover how to iterate over parameters etc.

1 Like