Hi all,
I know this topic has been covered, and I have no problem to combine 2 IRFs in 1 graph, but I would like to ask whether the codes to combine 3 IRFs is the same as the codes used to combine 2 IRFs? I used the codes below, and somehow the IRF for toying2 was not appearing. When I only combined 2 IRFs, say toying and toying2, the IRF for toying2 appeared. Therefore, could anyone check whether my codes to combine 3 IRFs in 1 graph correct?
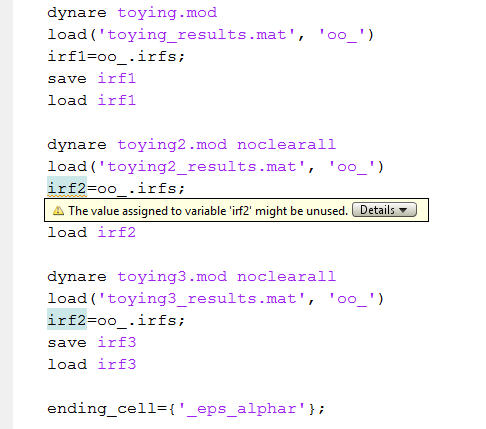
dynare toying.mod
load(‘toying_results.mat’, ‘oo_’)
irf1=oo_.irfs;
save irf1
load irf1
dynare toying2.mod noclearall
load(‘toying2_results.mat’, ‘oo_’)
irf2=oo_.irfs;
save irf2
load irf2
dynare toying3.mod noclearall
load(‘toying3_results.mat’, ‘oo_’)
irf2=oo_.irfs;
save irf3
load irf3
ending_cell={’_eps_alphar’};
for ii=1:length(ending_cell)
HOR=1:options_.irf;
var={‘cn’, ‘cr’, ‘y’, ‘dp’};
figure
for jj=1:length(var)
    subplot(3,3,jj)
    eval(['irf1.' var{1,jj},ending_cell{1,ii}]);
    eval(['irf2.' var{1,jj},ending_cell{1,ii}]);
    eval(['irf3.' var{1,jj},ending_cell{1,ii}]);
    hold on
    plot(HOR,[eval(['irf1.' var{1,jj},ending_cell{1,ii}])],'-b',HOR,[eval(['irf2.' var{1,jj},ending_cell{1,ii}])],'-m',HOR,[eval(['irf3.' var{1,jj},ending_cell{1,ii}])],'-g', 'linewidth',2) ;
    title([var{1,jj}] )
    legend({'toying','toying2','toying3'},'location','southoutside')
    box on
end
end
thank you so much for helping me! I appreciate it!