2 Plots in one graph

Hello Community,

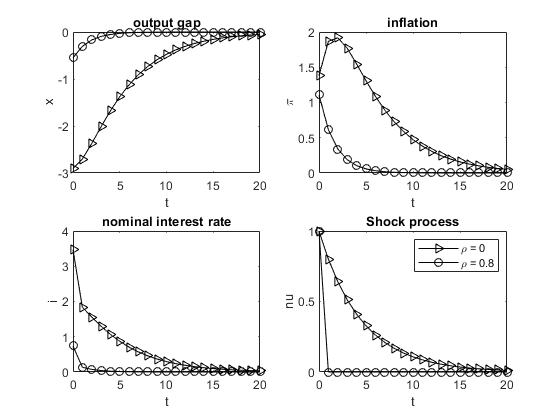
I want to plot this code with AR=0.8 and AR=0 in one diagramm. Is there any example how to do it?

Blockquote
var pi ypsi x i ;
varexo eps;
parameters beta gamma_f gamma_b k AR_par phi sigma lambda;
sigma =2;
beta = 1;
phi = 0.5;
k =0.2;
gamma_f= 0.5;
gamma_b= 0.5;
AR_par= 0.8;
lambda= 0.5;
model(linear);
pi = beta*(gamma_fpi(+1) + gamma_bpi(-1))+ kx + ypsi;
ypsi = AR_par
ypsi(-1) + eps;
x =(1-phi)x(+1)+ (phix(-1)) - 1/sigma*(i - pi(+1));
%i= ((1-phi)x(+1)+phi(x-1)-x)sigma + pi(+1);
end;
shocks;
var eps =1;
end;
//planner objective with parameters updated in steady state file
planner_objective 1/2
(pi^2 +lambdax^2);
discretionary_policy(instruments=(x),irf=13,planner_discount=beta) x pi i ypsi;
x_pos=strmatch(‘x’,var_list_ ,‘exact’);
pi_pos=strmatch(‘pi’,var_list_ ,‘exact’);
variance.x=oo_.var(x_pos,x_pos);
variance.pi=oo_.var(pi_pos,pi_pos);
L= (0.5
variance.pi)+ (0.25*variance.x)

Hi Faro,

If AR_par is the parameter that regulates the persistence of the shock, and in your benchmark calibration you have calibrated it to 0.8, what you can do is to use set_param_value as in the following minimal working example, where I plot the impact the shock has on inflation under the two different persistence regimes.

// model block

// shock block

stoch_simul(irf=20,nograph);
large_persistence = oo_.irfs;
set_param_value('AR_par',0.1);
stoch_simul(irf=20,nograph);
small_persistence = oo_.irfs;

L=1:options_.irf;

figure
plot(L,large_persistence.pi_eps,'-b',L,small_persistence.pi_eps,'-r')

For more complicated plotting, see for example

Hi cmarch,

Thanks for your help. I Think I can not use stoch_simul when I use Ramsey policy.

Yes, sure you are right. The example above refers to stoch_simul, but since IRFs are stored in oo_. in the same fashion, you can apply the set_param_value in the same way when you use Ramsey policy :slightly_smiling_face:.

I hope I understand it right.
So, I would change my code to:

Blockquote
// shock block
discretionary_policy(instruments=(x),irf=13,planner_discount=beta) x pi i ypsi;
large_persistence = oo_.irfs;
set_param_value(‘AR_par’,0);
discretionary_policy(instruments=(x),irf=13,planner_discount=beta) x pi i ypsi;
small_persistence = oo_.irfs;

Blockquote
L=1:options_.irf;
figure
plot(L,large_persistence.pi_eps,‘-b’,L,small_persistence.pi_eps,‘-r’)

I dont know about these lines?

Yes, exactly :slightly_smiling_face:.
These lines of code make the IRFs appear in the same plot :slightly_smiling_face:.

L=1:options_.irf;
figure
plot(L,large_persistence.pi_eps,’-b’,L,small_persistence.pi_eps,’-r’)

Thank you!
This is my code now:

var pi ypsi x i ;
varexo eps;
parameters beta gamma_f gamma_b k AR_par phi sigma lambda;

sigma =2;
beta = 1;
phi = 0.5;
k =0.2;
gamma_f= 0.5;
gamma_b= 0.5;
AR_par= 0;
lambda= 0.5;

model(linear);
pi = beta*(gamma_fpi(+1) + gamma_bpi(-1))+ kx + ypsi;
ypsi = AR_par
ypsi(-1) + eps;
x =(1-phi)x(+1)+ (phix(-1)) - 1/sigma*(i - pi(+1));
%i= ((1-phi)x(+1)+phi(x-1)-x)*sigma + pi(+1);
end;

shocks;
var eps =1;
end;
// shock block
discretionary_policy(instruments=(x),irf=13,planner_discount=beta) x pi i ypsi;
large_persistence = oo_.irfs;
set_param_value(AR_par,0);
discretionary_policy(instruments=(x),irf=13,planner_discount=beta) x pi i ypsi;
small_persistence = oo_.irfs;

L=1:options_.irf;

figure
plot(L,large_persistence.pi_eps,-b,L,small_persistence.pi_eps,-r)
plot(L,large_persistence.x_eps,-b,L,small_persistence.x_eps,-r)
plot(L,large_persistence.i_eps,-b,L,small_persistence.i_eps,-r)
plot(L,large_persistence.ypsi_eps,-b,L,small_persistence.ypsi_eps,-r)

//planner objective with parameters updated in steady state file
planner_objective 1/2*(pi^2 +lambda*x^2);
discretionary_policy(instruments=(x),irf=13,planner_discount=beta) x pi i ypsi;

x_pos=strmatch(‘x’,var_list_ ,‘exact’);
pi_pos=strmatch(‘pi’,var_list_ ,‘exact’);

variance.x=oo_.var(x_pos,x_pos);
variance.pi=oo_.var(pi_pos,pi_pos);
L= (0.5variance.pi)+ (0.25variance.x)

but I get the error message:

Error using set_param_value (line 25)
Parameter name doesn’t exist

Error in dynad (line 151)
set_param_value(AR_par,0);

Error in dynare (line 235)
evalin(‘base’,fname) ;

and is is still one plot for AR= 0.8

I just added the shock block part and as you said the code to make IRFS appear in the same plot.

You need to write set_param_value('AR_par',0); and have AR_par=0.8 specified in the block of parameter values.

See my first reply above. Also, please format you code, it makes it easier to read.

Thanks a lot! It works now,! When I run my code I got one plot for AR= 0.8 and one for AR=0. How can I combine then? as this see for e.gdiscretion

I did this with matlab.

See Q: combining IRFs into subplotted figures & iterating?