- Plot your data. It looks weird.
- You did not provide the m-file delivering the parameter values to the mod-file.
Dear professor
Sorry my bad.This will do.
And could you please tell me which parameters looks weird?
Thanks for your help.
mymodel.mod (3.8 KB)
mymodel_paramsinit.m (549 Bytes)
myobdata.mat (3.2 KB)
myobdata.xlsx (22.8 KB)
Dear professor
Yes, I extract the trend and I thought this was right to do ![]() .
.
So should I extract the cyclical component for all parameters or just the same for inflation and rate?
I have the another data file that all parameters are cyclical component and I will try again.
Thanks.
Dear professor
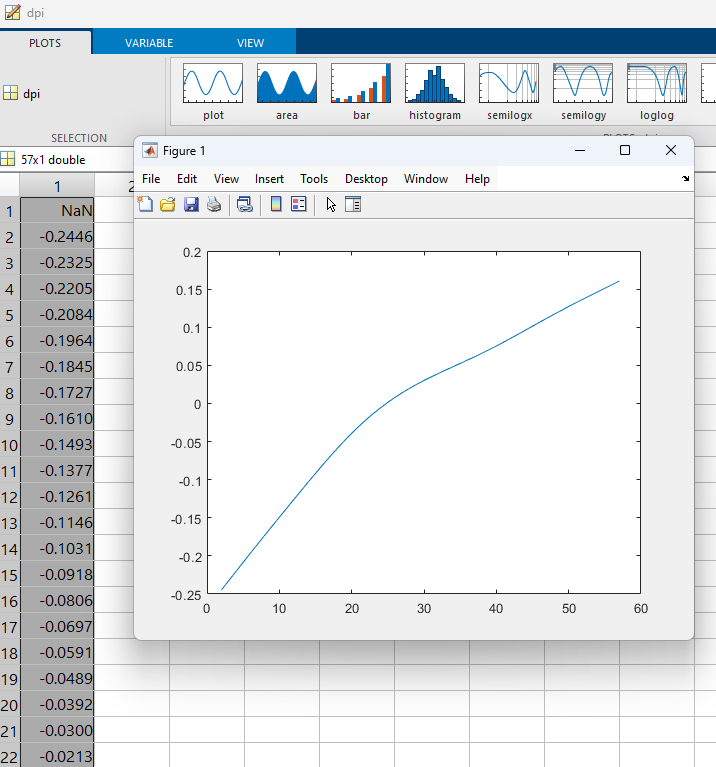
I used the equation obdata_pi = log(rawdata_pi)-log(detrended_pi) but the plot shows a smooth and upward-trending line.
What am I missing? Where have I done wrong? Or should I just use cyclical component as observed data? I think I misunderstood something here. ![]()
Yes, you should use the cyclical component.
obdata_pi = log(rawdata_pi)-log(detrended_pi)
is usually incorrect as detrended_pi should already by in logs.