Here is the dynare file and data file
RBC_v40.mod (4.5 KB)
data_Mar26.csv (537 Bytes)
Also, another question - can we change x-axis scales of prior-posterior density plots?
Here is the dynare file and data file
RBC_v40.mod (4.5 KB)
data_Mar26.csv (537 Bytes)
Also, another question - can we change x-axis scales of prior-posterior density plots?
It seems you scaled your shock standard deviation in the model by 100 to have 1 represent 1 percent. However, in the data 0.01 is equal to one percent.
Thank you so much for your help prof. Pfeifer. Really appreciate it.
Also, my question : Can we change x-axis scales of prior-posterior density plots? Or can I find the data for plots in one of the estimated files and I can use that to create my own plots?
That is not easily possible, but the manual documents various options that may be helpful.
Thank you Prof. Pfeifer. I will check again.
Also, regarding moments - suppose for model moments- I get 2.2 as SD then that is equivalent to 0.22 which is close to the data moment which I calculate from data. However, after estimated model, I get 0.11 as SD - since it has been calculated using data, I will report it as it is? Correct or i am still missing something.
My point is simulated model and estimated model(bayesian) moments should match the data?
2.2 SD will be read as 0.02 SD for simulated model which is not close enough to data moment of 0.12?
From what I can see, your prior forces the standard deviation to be singificantly higher than in the data. Also, why does your observation for c_obs have a clear downward trend?
I chose informative priors close/ equal to the calibrated values
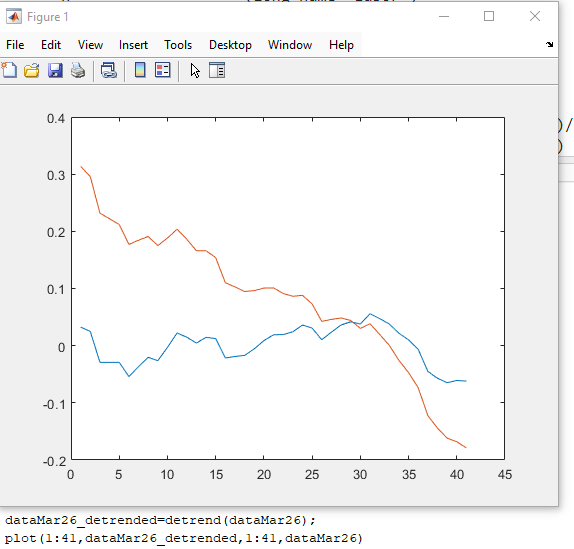
Yeah, I noticed the trend- I logged and detrended the original data (consumption divided by population). I have tried 2 methods to de-trend : removing the trend theough linear regression as well as one-way hp filter but I still get that trend.
oo_ structure but I also could not find it on the hard disk. Where exactly should I look.forecast option of estimation?Thank you gain for al your help Prof.
Can we extract the following from output files:
1.-3. The posterior draws used should be saved in the metropolis subfolder in the FILENAME_posterior_draws*.mat files.
4. Can you elaborate?
Thank you Prof. Pfeifer for 1 to 3.
On 4, I want to ask whether moments can be generated from the entire posterior distribution of paramters and not just mean of the posterior estimates of parameters?
That is what the moments_varendo option is for. See the manual.
I read through the manual and various posts. I have two clarifications:
In other words, is it possible to get posterior mean of the theoretical means for each endogenous variable? I understand that **PosteriorTheoreticalMoments.dsge.covariance.endogenous varaible**Contains the posterior mean of the variance-covariance matrix and Diagonal elements, like .consumption, represent the posterior mean of the variance of consumption. However, if I want the mean of an endogenous variable from the entire posterior distribution of parameters and not only mean, how do I get that. As of now “moments_varnedo” only reports “correlation” and “covariance”
If you are interested the posterior distribution of the variables means, they are reported when you run the smoother option.
Thank you for your response and help. So I ran the smoother option - are the results stored in “SmoothedVariables.Mean”. I can use those values to plot the posterior distribution of means? Will it be correct to report or analyze - mean of all the means which are reported under “SmoothedVariables.Mean”?