Here are the revised codes. As of now the results were with simulated data above but I they are similar with data too. I am attaching the revised codes and the data here.
RBC_Mar26.mod (4 KB)
data_Mar26.csv (533 Bytes)
Is it possible that there are some issues in the model because of which it is not possible to do estimate the parameters. Can anything be changed ? or what might be causing it. Looking forward to your help please.
Also, at some point you mentioned that my equation has a problem with respect to timing for z and it seems it is pre-determined? How can it be pre-determined- is it not driven by the exogenous shock epsilon- then why would you say it is predetermined? Is it not an exogenous process as per the model?
How did you treat your data? The mean for your observable is very different in the data compared to the model steady state.
So I divided my consumption data with population, then log transformed it and then de-trended it.
Then you should use the observation equation
c_obs=log(c)-log(steady_state(c));
data_Mar26.csv (537 Bytes)
RBC_Mar26.mod (4.1 KB)
P.S.: I hope you didn’t use a two-sided HP filter for detrending.
Thank you Prof. Pfeifer. Really grateful for your help. Sorry about my understanding.
- Can you explain why we use the above observation equation. This will be good for future understanding and also when dealing with my other models?
2)No, I do not use 2 sided hp-filter to de-trend. I read that in your paper on Observation Equations.
- As far as I understand, the model does not have any issues as such? Your thoughts?
- What do you think can cause estimation not possible?
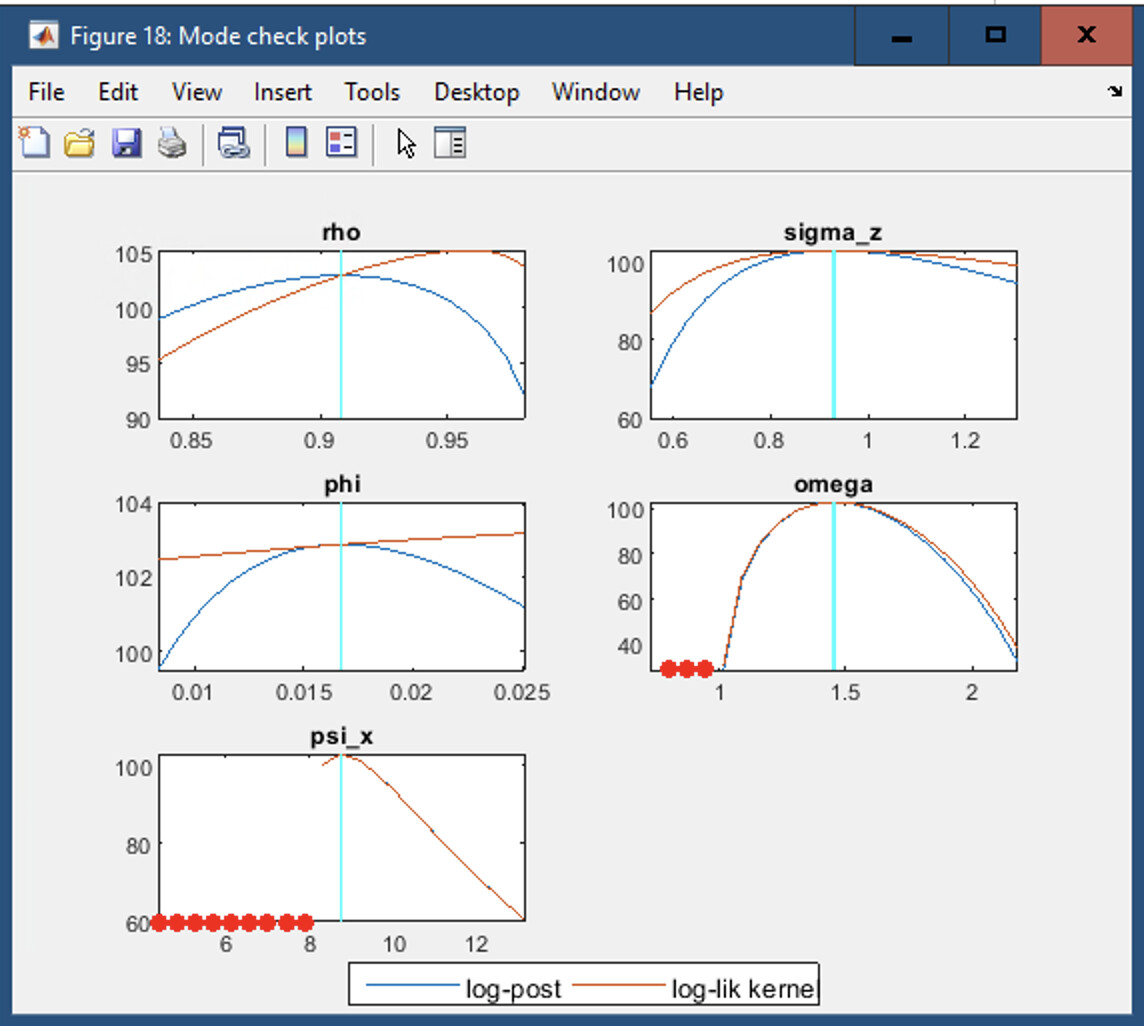
- Also, if mode check plots have red dots- it means BK conditions are not satisfied so I cannot estimate those parameters?
I want to undersand what might be going wrong which prevents parameter estimation?
Following up on my previous questions:
- I still have the question,can you explain why we use the above observation equation. This will be good for future understanding and also when dealing with my other models?
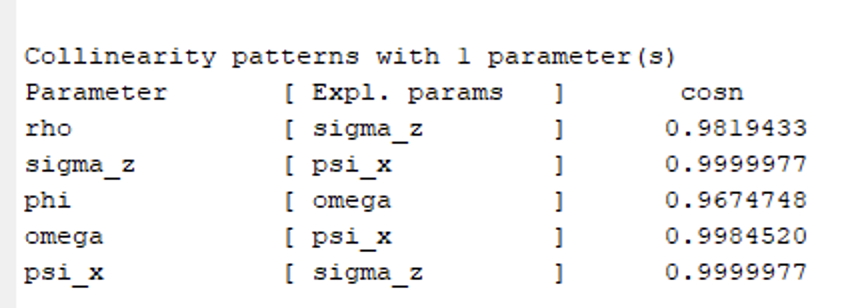
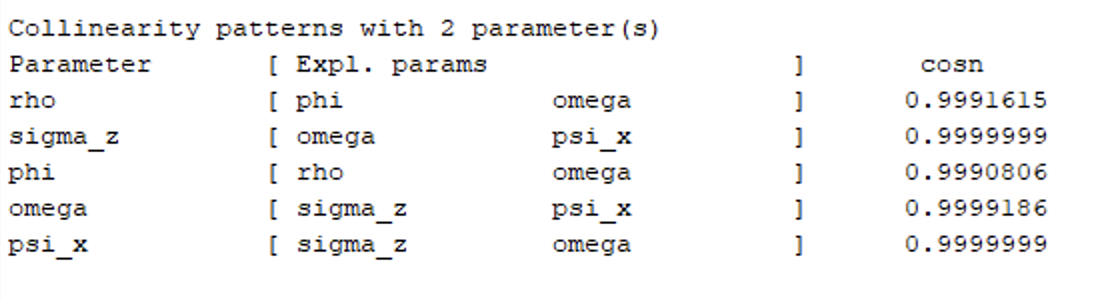
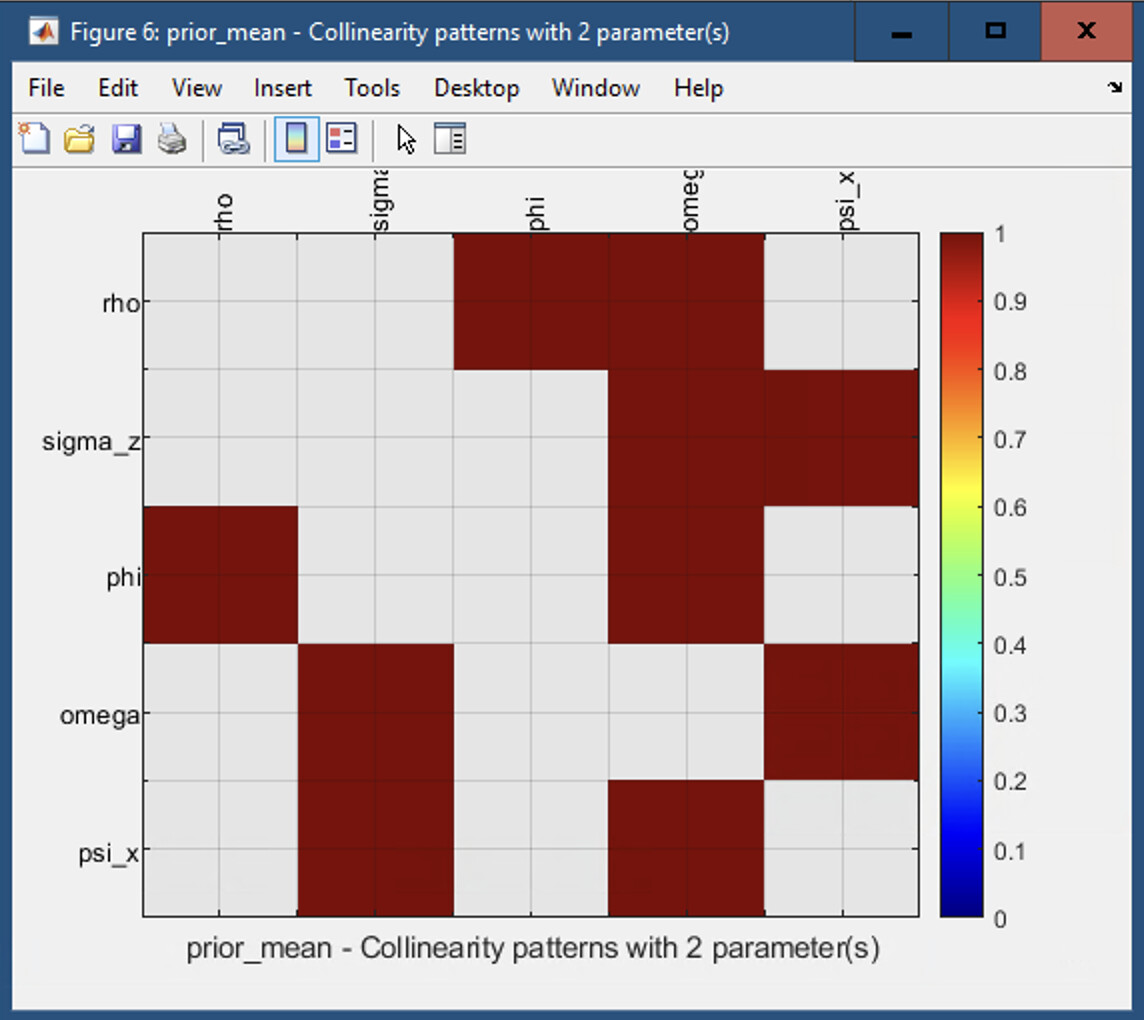
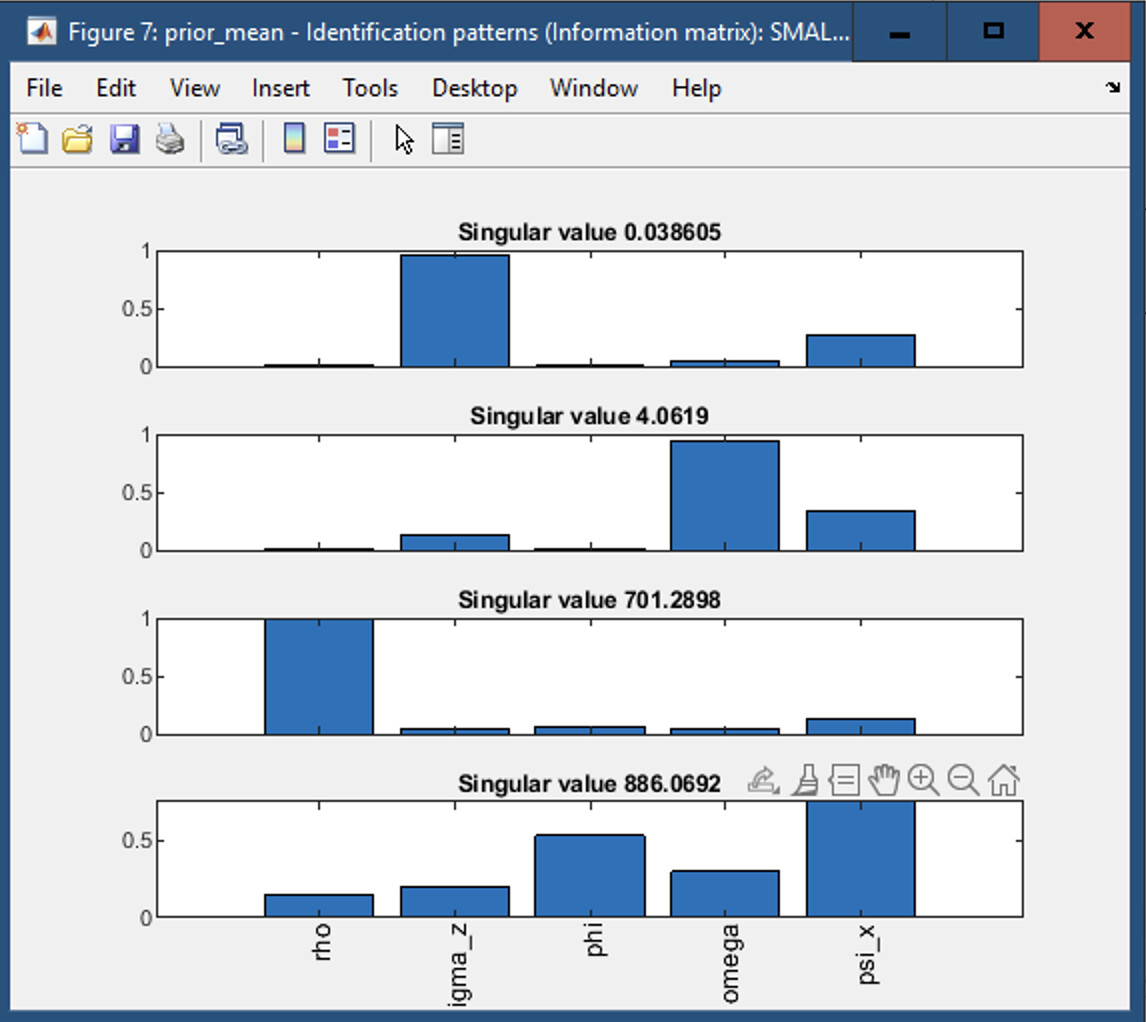
- Although identification analysis says " all parameters are identified", I am worried about the following plots and stats which I get. Does it reflect non-identifiability? Or I can just conclude weak identification of sigma_z and if so, why? Why is Std deviation of shock weakly identified? How can this be fixed in the model?
- What does red dots on mode check plots show- just that blanchard kahn conditions cannot be met for psi and omega? Also, is phi a problem?
Will be glad if you can please help?
Thank you Prof. Pfeifer for the reply. I owe you this help. I will check if I can find the reason for the red dots.
what does logical = 0 mean when I debug?
I also get the error in Tex compilation which I have not been able to solve as below:
Error using RBC_Mar26.driver
TeX-File did not compile.
Error in dynare (line 293)
evalin(‘base’,[fname ‘.driver’]) ;
I have been working on another model, a monetary model, a version of Monacelli (2005). I have set its log linear version up but it throws some error. Will be glad if you can help.
Monetary_model.mod (6.2 KB)
when you run this model in Dynare one of the problems is that you did not use \texttt{var} for your shocks in the shocks block.
Another problem is that the number of equations and the number of endogenous variables are not the same.
For debug, I give the command after running the entire program and getting all results. Is that not the correct way to debug, to find out reason for red dots?
For latex, I will try again, go through latex editor and see what might be the issue. If I am not able to fix it will bother you.
Thank you Eisa, I will try and fix those issues and check again.
You need to put options_.debug=true; before estimation.
Thank you Prof. Pfeifer
On my monetary model; I fixed all the previous issue and try my best in mapping it properly in dynare. However, I still find issues which might be due to improper mapping since the model cannot be wrong including its loglinear approximation. I find following errors
MODEL_DIAGNOSTICS: The steady state cannot be computed
MODEL_DIAGNOSTICS: Steady state contains NaNs
MODEL_DIAGNOSTICS: Steady state contains Inf
Attaching the revised file here. Please help.
Monetary_model.mod (4.2 KB)
You need to account for the non-zero mean observed variables:
Monetary_model.mod (4.3 KB)
Hello Prof. Pfeifer
I fixed certain equations which seemed to have been typed wrongly by me. However, I still get the error. When I checked the stability conditions in python, these set of equations were stable. I don’t know what might be going wrong. This model is a log-linear approximation. I will be glad if you can help please.
Monetary_model_v01.mod (4.2 KB)
Why does your model not have any forward-looking variables?