Thanks for your prompt reply.
I think I know the reason now, as the Matlab installed in my new laptop automatically chose the vertical axis range to be [-1,1], which makes the responses flat lines…
Below is the figure produced by my other laptop where the vertical axis range was specified as [-0.06, 0.14]…
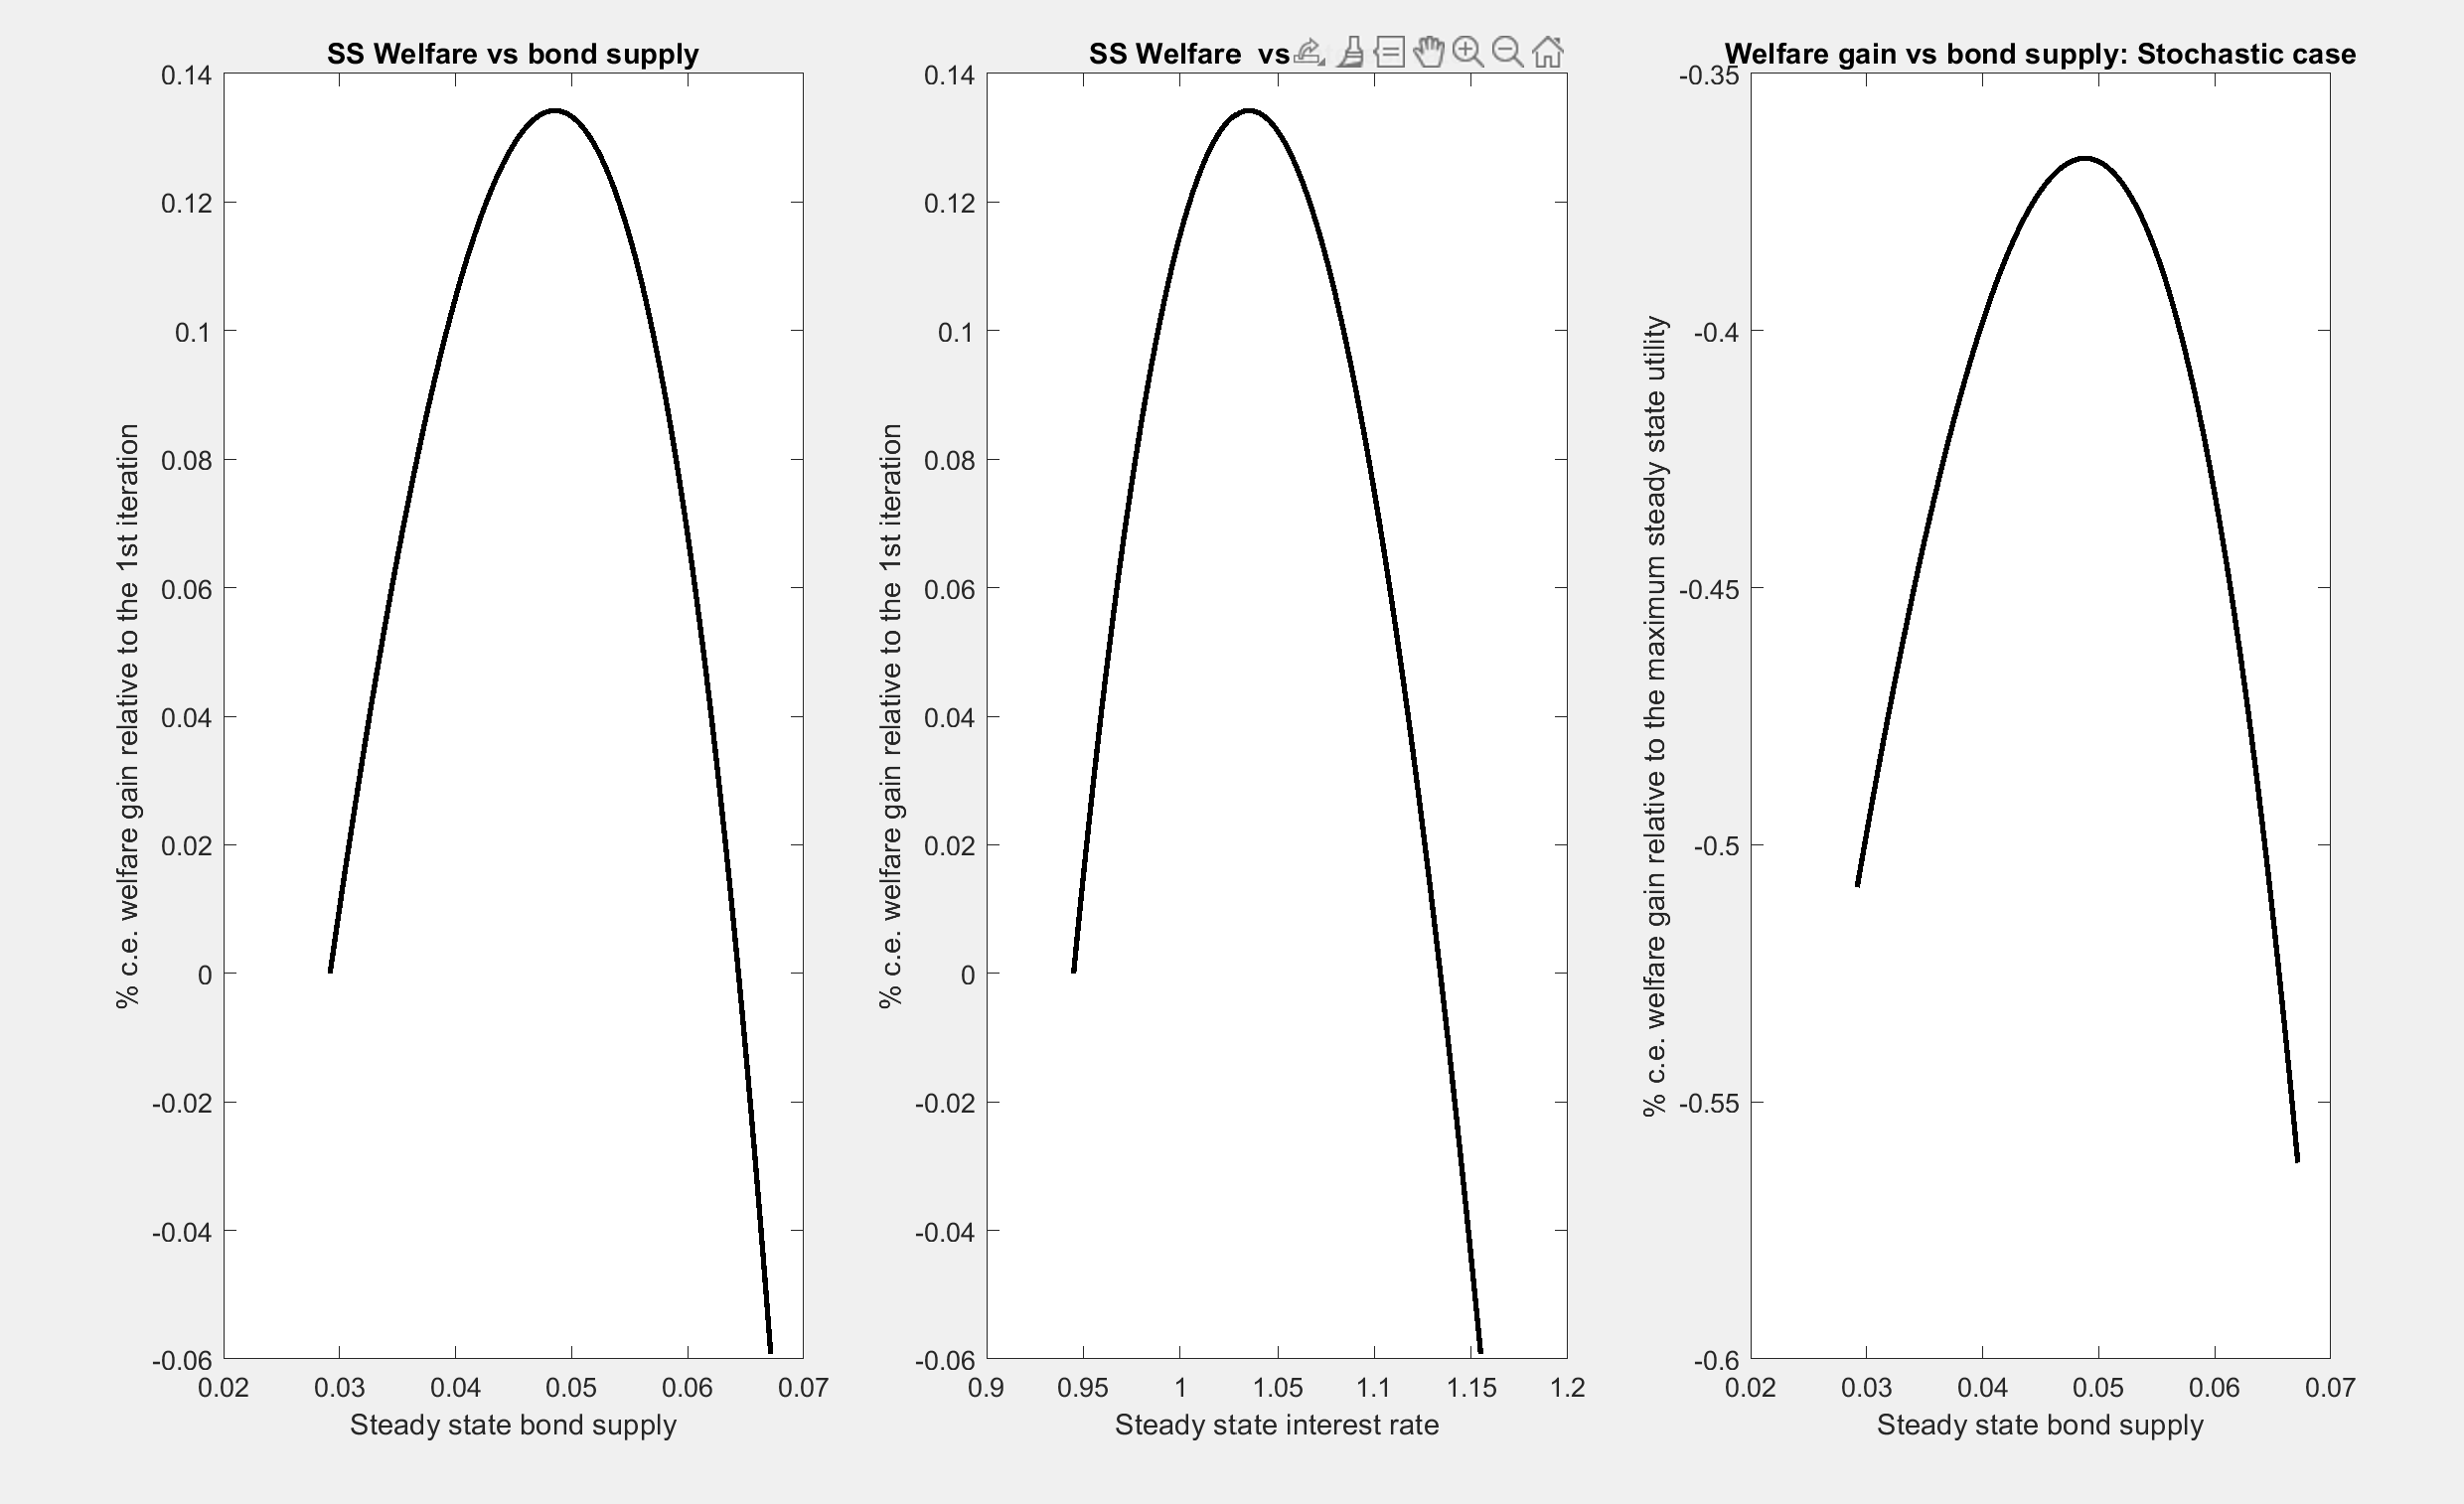
Now my question becomes how come there exists such discrepancy in the axis range automatically chose by Matlab?