Dear Johannes, could you explain in which sense 100*0.0018916 captures the mean growth rate in the data?
Thank you very much
Dear Johannes, could you explain in which sense 100*0.0018916 captures the mean growth rate in the data?
Thank you very much
The data grows by 0.0018916, i.e .0.2 percent per quarter, which is multiplied by 100 as everything is scaled by 100.
Hi!
I am trying to replicate GNSS too and actually I have a doubt regarding the observation equations. I have treated the data in the same way of GNSS therefore by detrending the real variables with the HP filter and by expressing interest rates as absolute deviations from the sample mean. For what concern the observation equations I am expressing them in growth rate terms too. In order to use the observation equations in this form e.g. 100*(0.0007868 + I - I(-1)) scaled up by 100 should I scale also my data by 100 before running the estimation right?
Thank you
I don’t really understand what you are trying to do.
Dear Pfeifer thank you for your reply,
I am bit confused by the replication mod file of GNSS that you can find on mmb.
First the observation equations are expressed in a way that I find strange for a non linear model and considering how they treated the data (i.e. log deviations from HP-filter trend and in absolute deviations from sample mean).
in the original mod file observation equations are written as :
interestPol   = 400*exp(r_ib);
interestH = 400*exp(r_bh);
interestF = 400*exp(r_be);
inflation  = pie*100;
loansH = BH*100;
loansF = BE*100;
output     = Y1*100;
consumption = C*100;
investment = I*100;
deposits = D*100;
interestDep = 400*(exp(r_d));
bankcapital = 100*K_b;
Shouldn’t be e.g. consumption = 100*(C-steady_state(C))?
Second sorry again for the trivial question again, if in the observation equation you multiply everything by 100 to have them in percentage terms, should also the detrended/demeaned data multiplied by 100 before running the estimation to match the observation equations?
Third, if this “100*(C-steady_state(C))” is the correct way of specifying the observation equations in case the steady state has been estimated by the authors it is possible to use the estimated steady state instead of the dynare operator in the equation?
e.g. interestPol = 400*(r_ib-r_ib_ss).
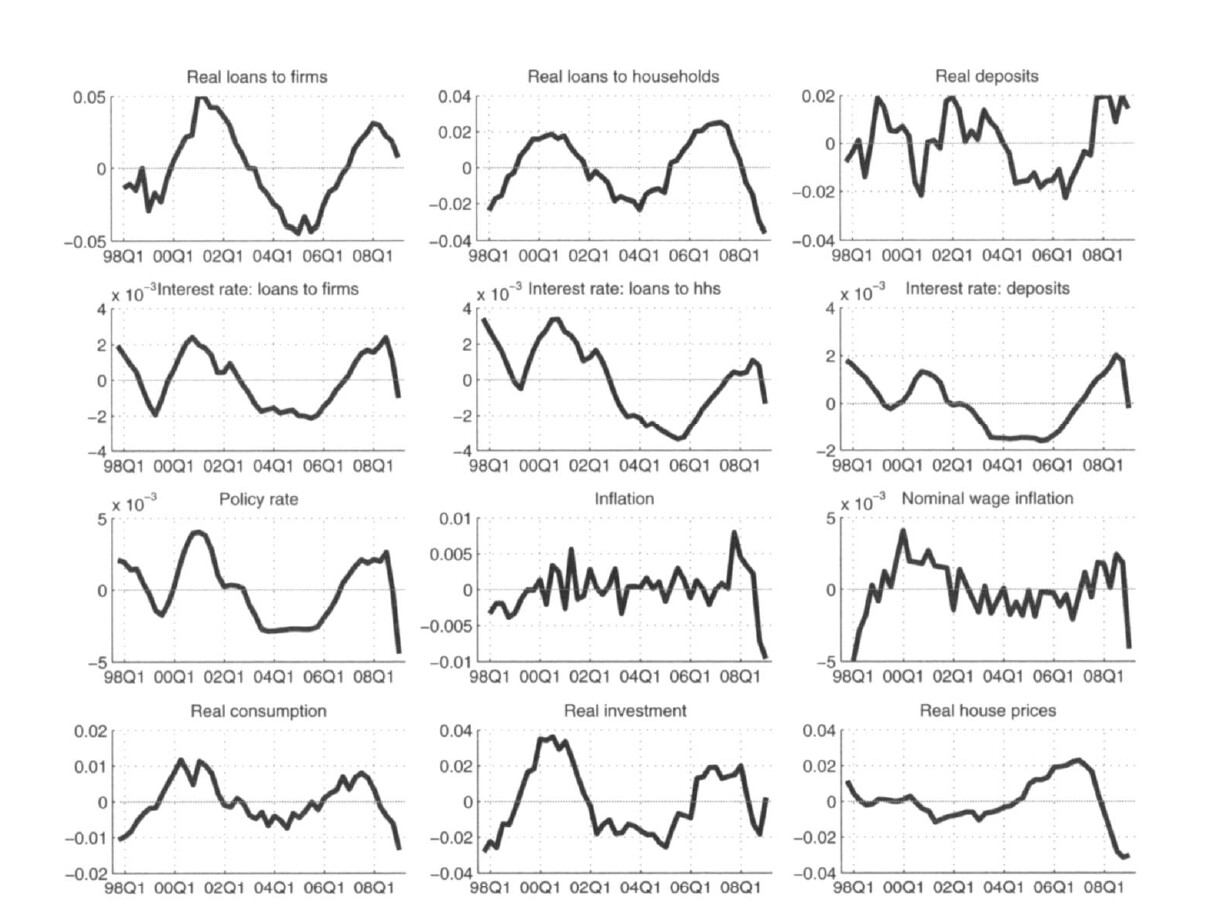
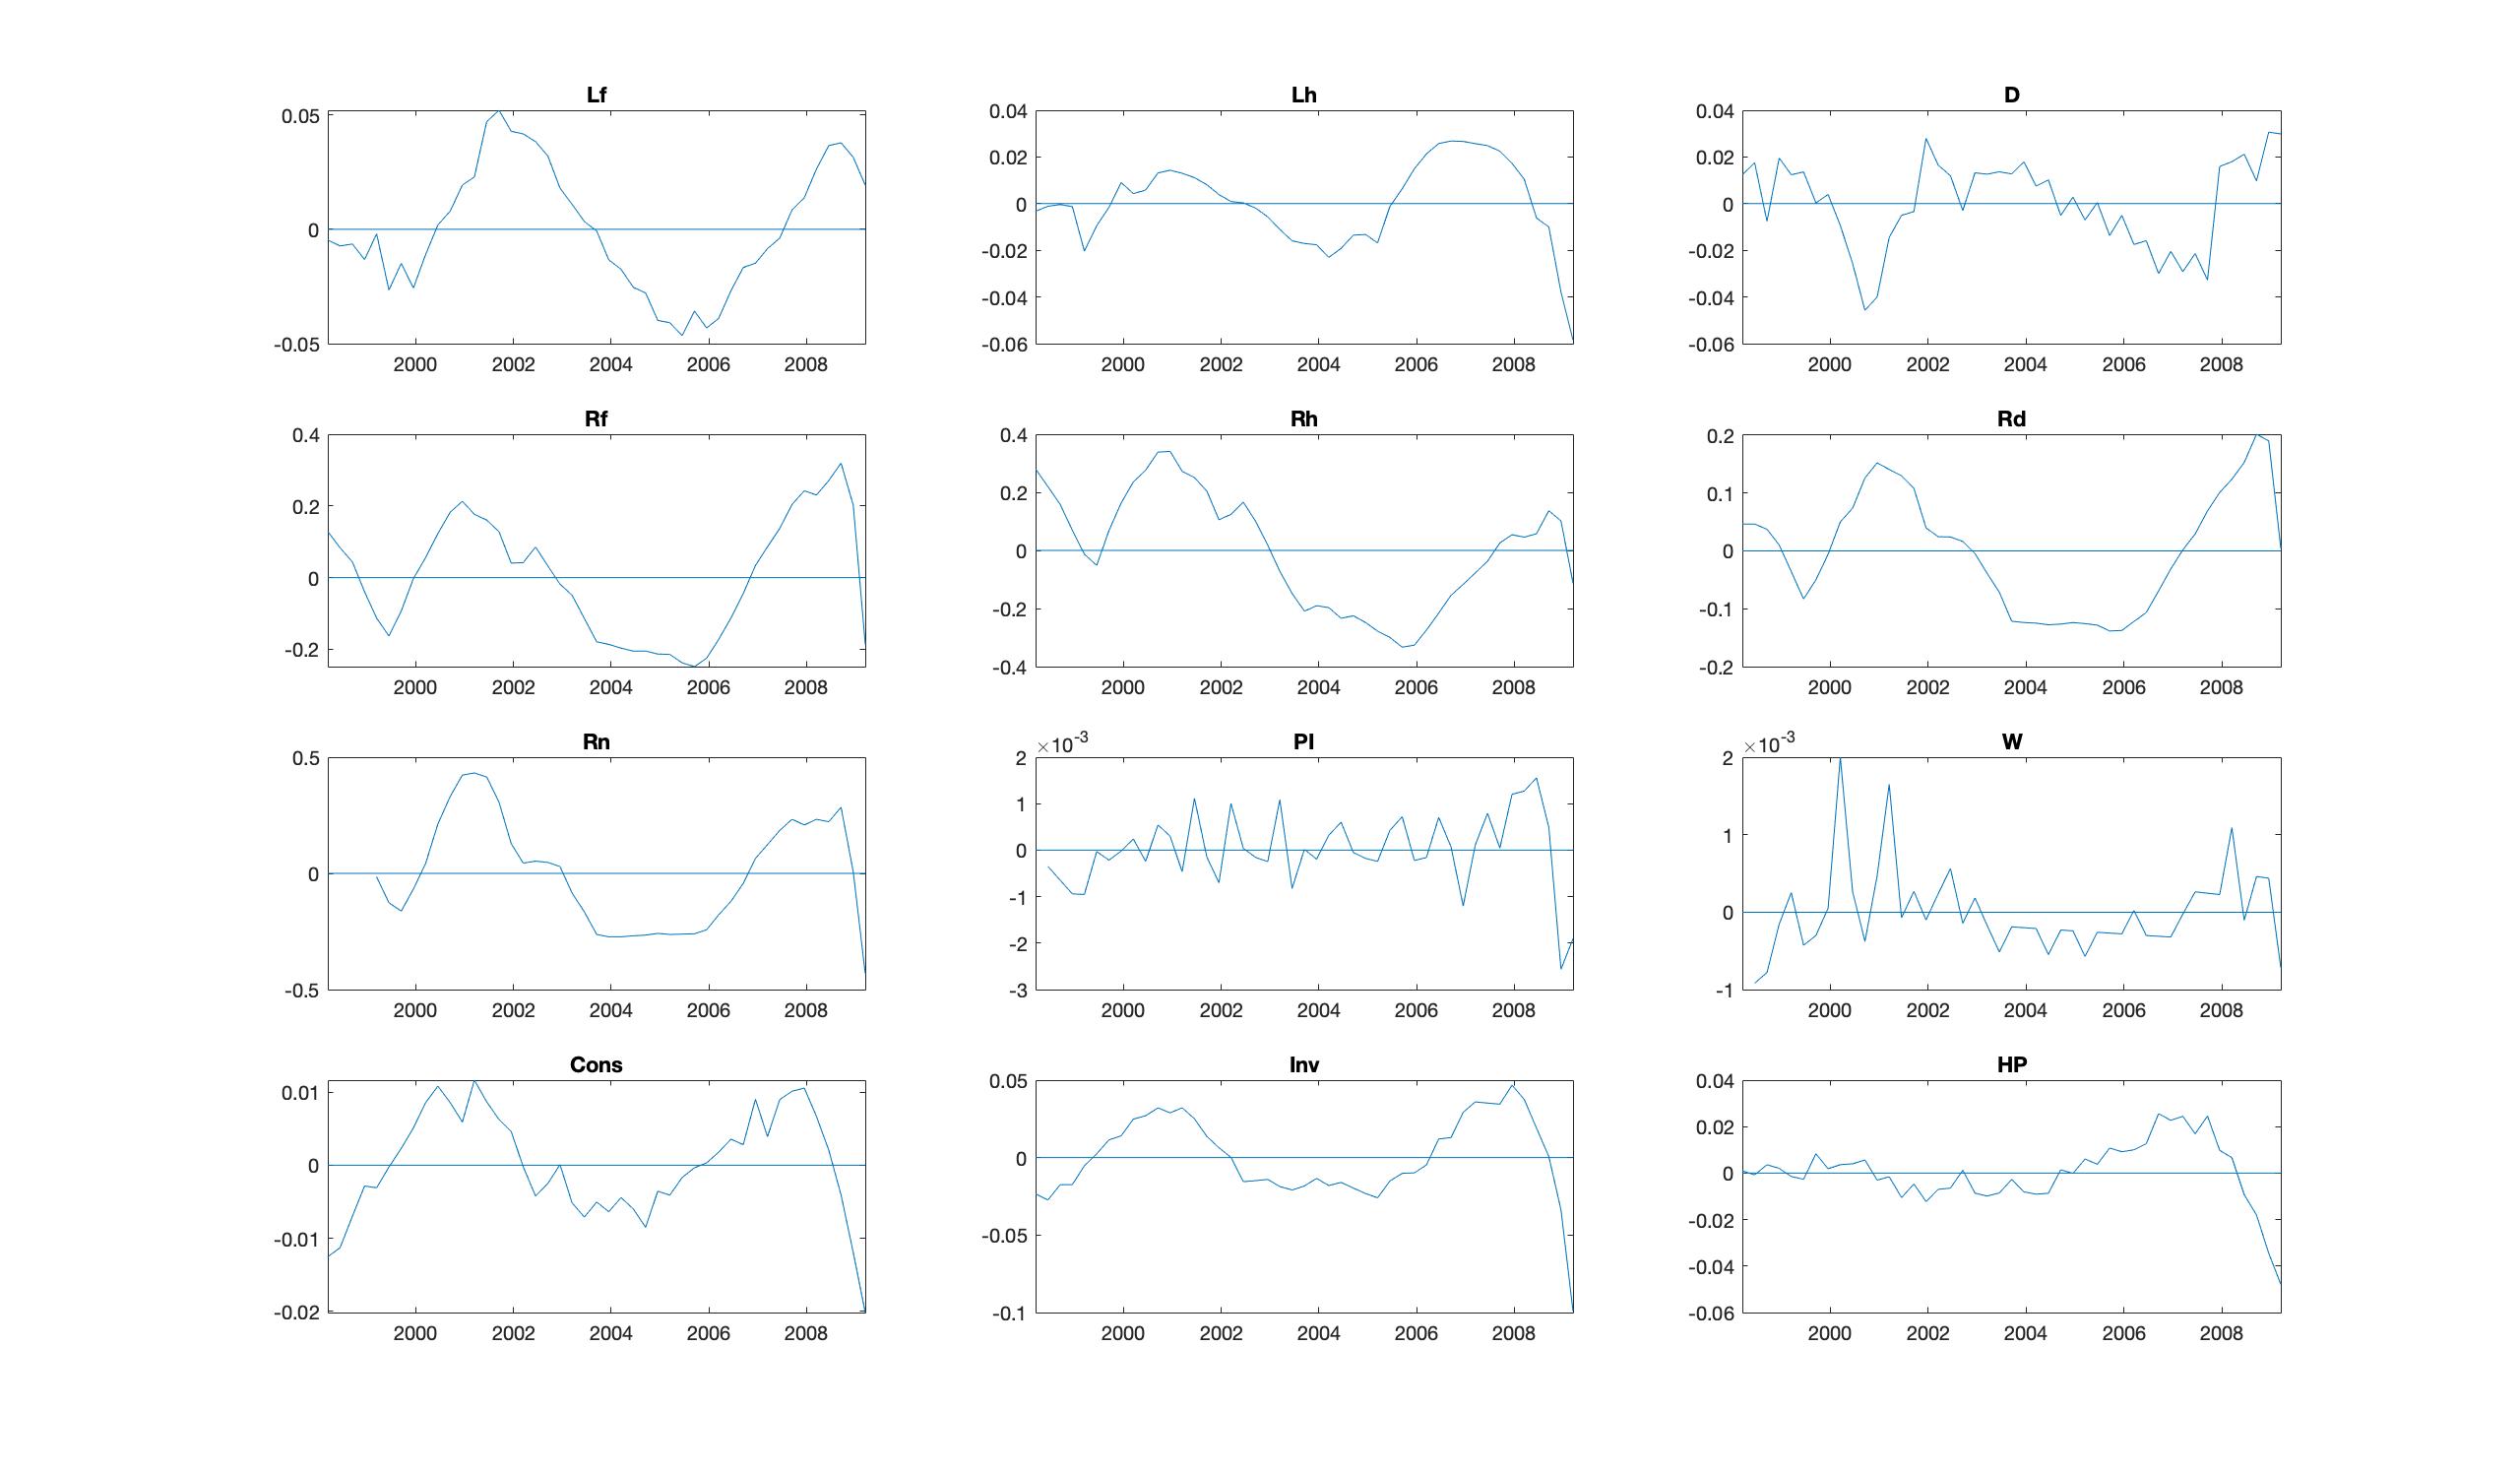
Thank you again, attached you can find the transformed data, the graphs from them and those of GNSS, the original mod file and my mod file for the estimation.
I have no clue what is going on in that file. The observation equations make no sense and parameter dependence is not correctly handled. You may have to ask the authors that the MMB forum.
Thank you for your answer. I have written directly to the authors asking them if they could share their original code.
Best
Dear all,
Hello, everyone. I have one question about the original code.
In the code, I’m so wondering why the output is replaced by the variable, ‘Y1’.
Someone said this variable is intermediate output. But I don’t really understand what that means.
Does the one ensure that ‘Y1’ reflects the market clearing condition in the paper? The condition includes all management cost and adjustment costs, but in the code, it is just the sum of consumption and investment. (But I find that the authors stated the alternative definition of output in the section 5.)
Why does the central bank’s equation use the Y1 as output? How can it be consistent with the retailer’s equation that use output as production function?
Thank you so much in advance.
Best regards,
Sangun Shin.
For future reference: