Yes. The sigma are normal estimated parameters for which you can request a autocorrelation plots.
I also tried to estimate some of the parameters of the model. Unfortunately, I didn’t manage to produce some good looking results. Could you give me some advice on how I can improve the code to obtain some valid estimation results?
Thanks!
NK_baseline.mod (10.4 KB)
NK_baseline_steadystate.m (4.3 KB)
test.csv (29.9 KB)
I think you still have an issue with the constant terms in your data. Why would e.g. the mean of inflation in the data coincide with PIbar = 1.01?
Thank you Prof. Pfeifer! I’ll further investigate this issue. Isn’t PIbar = 1.01 the constant term in (or SS value of) gross inflation, such that if I take log(PI) as my observation equation, my data for inflation should be consistent with the mean in net inflation?
I just got another question regarding the choice of observables. If the resource constraint of the model states that output is equal to the sum of consumption and investment, is it in general possible to include observed data for output, consumption, and investment growth?
- Yes, but your mean of net inflation in the data is not 1 percent per quarter. Similarly, you impose cointegration for the growth of various variables, which seems to be problematic from the perspective of the data.
- No, you cannot include all parts of the resource constraint as being observed unless there is measurement error. Otherwise there will be stochastic singularity.
Thank you Prof. Pfeifer!
Does cointegration imply that the means of the observed growth rates of cointegrated variables must be exactly equal to each other as theory would dictate? Or could those means be slightly different without leading to an error in estimation? I mean, if I were to use observed GDP and consumption growth for the US as my data sample, those means won’t be exactly equal to each other. Is it therefore in practice a dominant strategy to always demean growth rates? Or could I also demean the growth rates by their individual means and add the mean of GDP growth afterwards in order to make the means consistent?
Not exactly, but they cannot be too far away from each other in a longer sample.You can try whether demeaning the series helps.
Thank you Prof. Pfeifer!
I tried to use demeaned data for GDP growth and matched the steady-state of inflation to the mean of the observed inflation series. Unfortunately, I still have difficulties to obtain good-looking or put another way valid results. Could you give me another hint on how to make the estimation work?
test.csv (15.0 KB)
NK_baseline.mod (10.0 KB)
NK_baseline_steadystate.m (4.3 KB)
One thing you can try is to re-parameterization of some of the parameters like
betta. Checkout this video by prof. Pfeifer on this from 02.02.41 to 02.03.49 https://www.youtube.com/watch?v=GJjSwnikwW4&t=8405s.
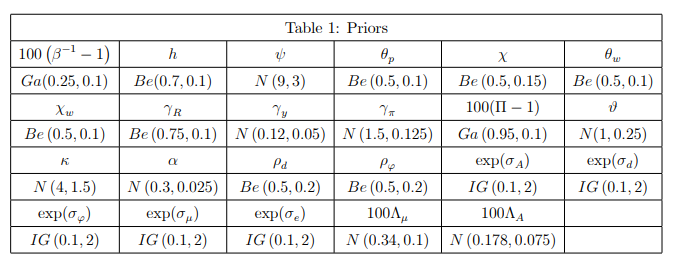
Also I highly recommend you read the original paper the model is based off. (Link: https://www.nber.org/system/files/working_papers/w14677/w14677.pdf) . In the paper author uses following set of priors. Notice the autor uses re-parametrization for betta, PI bar, LambdaA, Lambdamu and sigma terms.
Hope this helps.
Thank you!
You need to investigate the mode_check plots to see which parameter differences cause this.
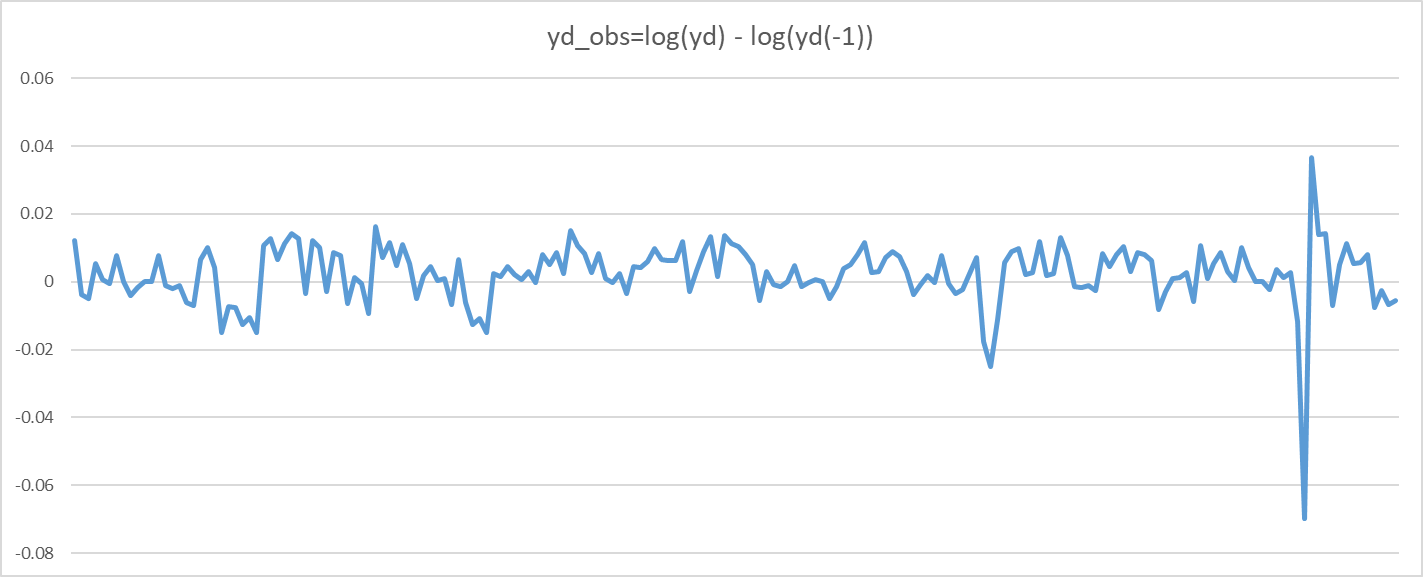
If I specify the observation equation for demeaned output growth as
ydobs = log(yd) - log(yd(-1)) ,
am I mistaken that the observed data should not be in percentages, even though I use Dynare to solve the non-linear model by using a first-order perturbation?
What do you mean with that? Log differences are, up to first order, equal to growth rates measured in percent.
I mean the data shouldn’t be scaled by 100 or am I wrong? With the above observation equation, the data should for instance be in the format of 0.02 instead of 2?
That ultimately depends on your shock specification. In a linear model, you could scale everything by 100 by increasing the shock standard deviations.
Hello professor,
Is it prudent to define the observable GDP per capita as below?
yd_obs = log(yd) - log(yd(-4))
It’s just year on year output growth. It has the same information content as standard quarterly growth rates. The only downside is that you are losing four observations at the beginning of the data set.
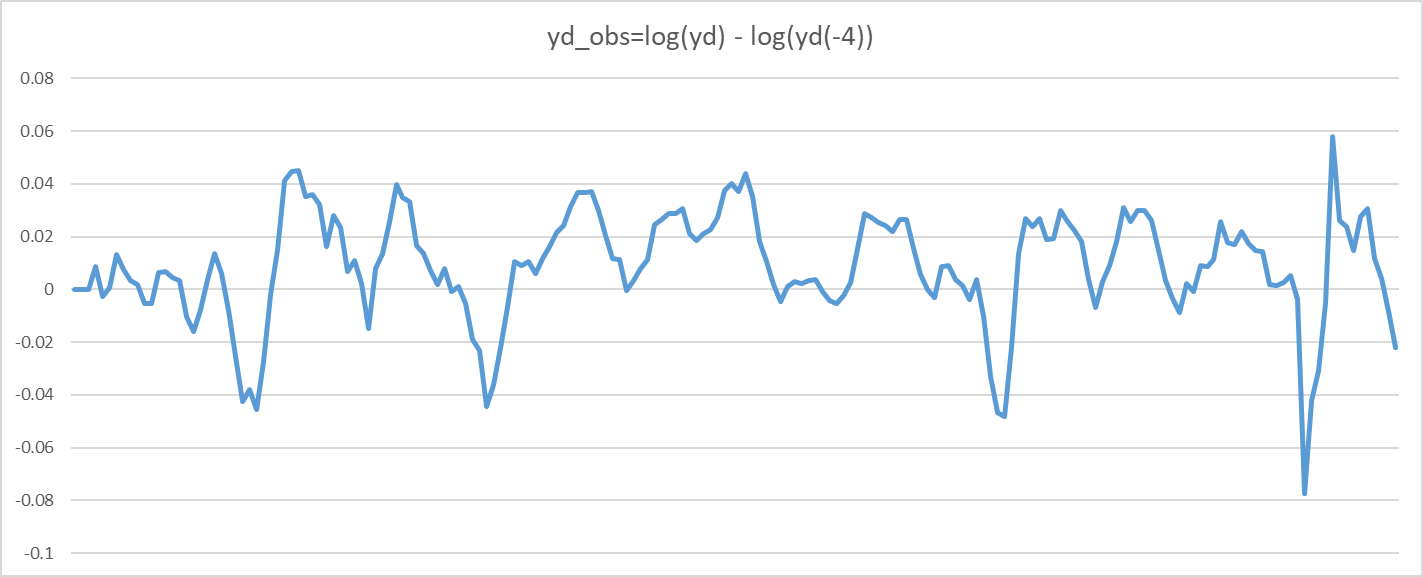
Yes, it looks smoother, but that does not matter. The information content is exactly the same except for the first 4 periods. Thus, it will (almost surely) not alter results.