90% HPD intervals of posteriors have no width

Dear All,

I am trying to estimate an NK DSGE model to compare the impacts of different environmental policies on macroeconomic fluctuations in China. I am currently working on estimating the baseline model, and I ran into some questions with the posterior estimates. Specifically, the 90% HPD intervals (which I read in some other posts are like confidence intervals) have no width - for example, for rhoa, both the lower and upper bounds of the 90% HPD interval are 0.8576, which is the same as the estimated posterior mean.

I have attached a screenshot and my mod and data files below. If anybody could take a look and point me to what the issue could be, I would greatly appreciate it! Take care!

Best regards,
Yang

test.mod (5.8 KB) cn_test.xlsx (15.3 KB)

You have a weird prior with an asymptote

Prior distribution for parameter rhoK has unbounded density!

that pushes rhoK to its bound. As a consequence, the MCMC has an acceptance rate of 0. This explains the degenerate HPDIs.

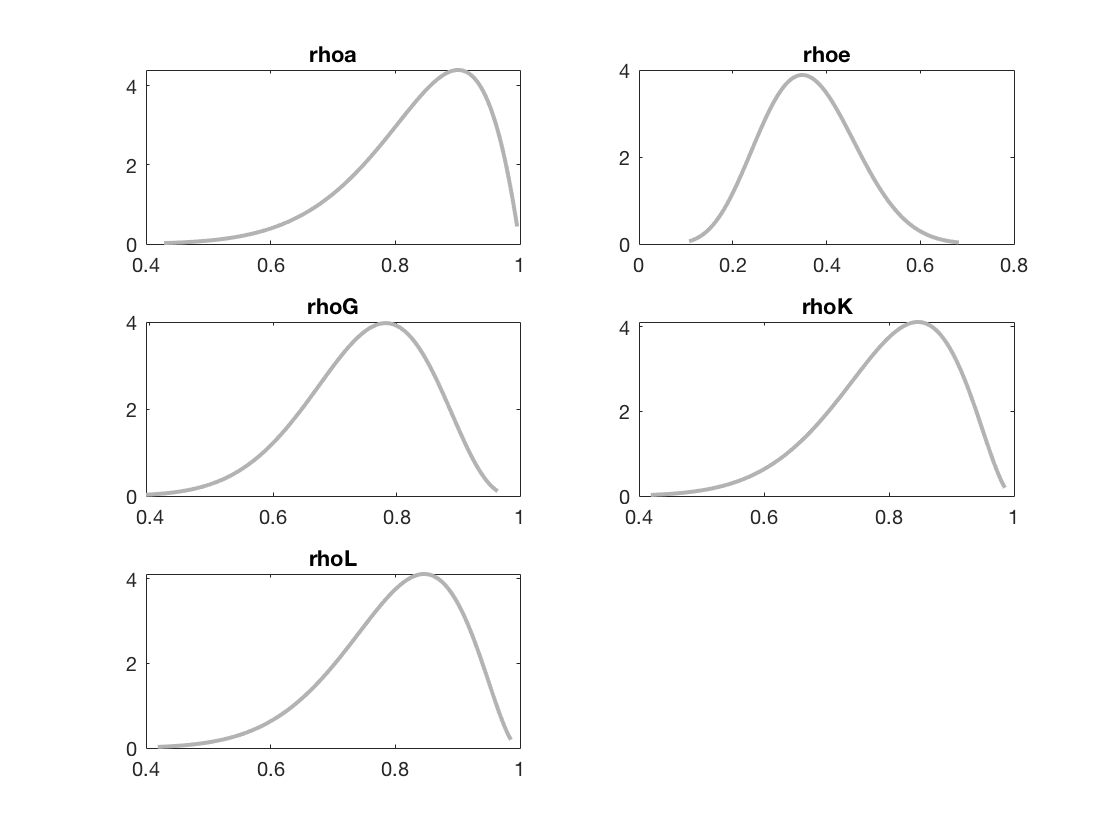
Professor Pfeifer, thank you for the response. The issue persists when I change the prior mean of rhoK to 0.8 - as shown below, none of the priors are asymptotes now, yet the acceptance rate for MCMC remains to be 0. I read in this post that the problem might be with the data, but I am not entirely sure after reading all the relevant posts about acceptance rates. What do you think the issue might be in this case? Thanks again.

An obvious issue is that your are mapping mean 0 data to model variables that have a non-zero steady state. That will push the estimation towards a unit root.

Thank you, Professor. From reading your guide to observation equations and other relevant posts, I see that log-linearizing would produce model variables with zero steady states that match the HP-detrended data. Am I correct to understand that to proceed, I would either 1) log-linearize the model by hand, input the model in Dynare using the model(linear) option and specify the steady states as zero; or 2) avoid using HP filtering which produces mean-zero data and use some other filtering method?

No, in a nonlinear model you can simply define deviations from steady state

c_hat=log(C)-log(steady_state(C))

Also, do not use a two-sided HP filter. Use a one-sided HP filter

I appreciate the helpful comment, Professor. I made the suggested changes and made sure to use a one-sided HP filter (please attached find the updated mod and data files). The posterior modes have positive standard deviations, but the posterior means still have zero-width HPD intervals. Acceptance ratio of MCMC is still pushed to zero, and there is a warning that ‘Matrix is singular to working precision.’ Running the ‘identification’ command doesn’t point to any identification issues. From your experience, what do you think could be the remaining issue here?

cn_test.mod (6.1 KB) cn_test_one_sided.xlsx (15.4 KB)

Again, I appreciate your time and patience. Take care!

Best,
Yang

When I use a different mode_compute and Hessian, i.e.

estimation(datafile='cn_test_one_sided.xlsx',xls_range=A1:D97, mh_replic=100,mh_nblocks=1,mh_jscale=0.8,conf_sig=97.5,bayesian_irf,irf=100,mode_compute=5,mode_check);

it works.

Thank you, Professor! It works now!