Questions on graphics

Hi,

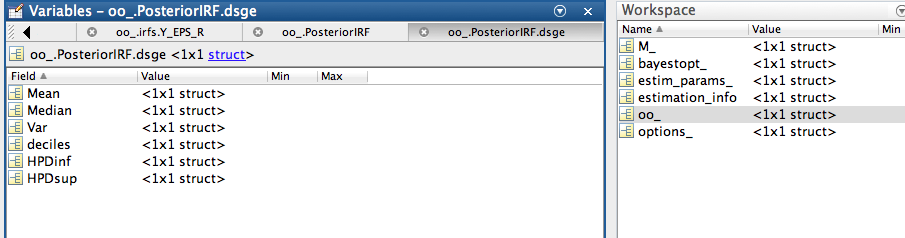
  1. After estimating a model, i want to recreate the bayesian irf graphs with confidence intervals (example attached) that are printed along with the output. I tried looking into oo_.PosteriorIRF.dsge but it didnt have the option of “distribution” (the screenshot is attached). If i remember correctly an earlier version of dynare had this option. Has it been moved elsewhere?

  2. secondly, when i run my estimation without the “nograph” command i encounter the following error. Any suggestions?

Error using f1
Too many output arguments.

Error in PlotPosteriorDistributions (line 135)
top1 = max(f1);

Error in dynare_estimation_1 (line 804)
oo_ = PlotPosteriorDistributions(estim_params_, M_,
options_, bayestopt_, oo_);

Error in dynare_estimation (line 89)
dynare_estimation_1(var_list,dname);

Error in mp_cc5 (line 525)
dynare_estimation(var_list_);

Error in dynare (line 180)
evalin(‘base’,fname) ;
Screen Shot.pdf (55.5 KB)
Bayesian_IRF_EPS_A_1.pdf (8.7 KB)

  1. Everything you are looking for is there. You have both the deciles and the lower and upper bounds of the HPDIs.
  2. Try the most recent unstable version. If the problem persists, provide the mod-file and the data-file.

Hi Johannes,

thanks a lot for the response.

  1. I realize that all the information is there, but is there a way to create the graph in the same format (with the bands instead of just lines). Maybe there is a matlab file in the dynare package that i can turn to to get guidance on how to plot such graphs outside of dynare?

  2. I tried both the unstable and the latest stable release(4.4.3) but the problem persists. The mod file is attached. Please also find the links to the data and mode file below (i couldn’t attach them here)

dl.dropboxusercontent.com/u/144 … ta_aug.mat
dl.dropboxusercontent.com/u/144 … 6_mode.mat

thanks again!
mp_cc6.mod (12.7 KB)

You need to use Matlab’s area plot. The Dynare code for the IRFs is

h1 = area(1:options_.irf,HPDIRF(:,2,j,i)); set(h1,'FaceColor',.9 .9 .9]); set(h1,'BaseValue',min([min(HPDIRF(:,1,j,i)),min(HPDIRFdsgevar(:,1,j,i))])); hold on; h2 = area(1:options_.irf,HPDIRF(:,1,j,i)); set(h2,'FaceColor',[1 1 1]); set(h2,'BaseValue',min([min(HPDIRF(:,1,j,i)),min(HPDIRFdsgevar(:,1,j,i))])); plot(1:options_.irf,MeanIRF(:,j,i),'-k','linewidth',3) % plot([1 options_.irf],[0 0],'-r','linewidth',0.5); plot(1:options_.irf,MeanIRFdsgevar(:,j,i),'--k','linewidth',2) plot(1:options_.irf,HPDIRFdsgevar(:,1,j,i),'--k','linewidth',1) plot(1:options_.irf,HPDIRFdsgevar(:,2,j,i),'--k','linewidth',1) box on axis tight xlim([1 options_.irf]); hold off
2. The error message indicates a naming conflict. You seem to have a file called f1 present in your path. Try typing

into the command window to identify where this file is. I cannot replicate your problem.

thanks a lot!