Dear al,
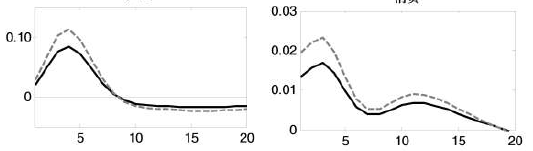
I want to put multipled impulse responses in a graph.I know the data is stored in ‘oo_.irfs’.I got the following figure.

The picture begins with the period 1. My question is how to start with period 0?The data in ‘oo_.irfs’ start from phase one. It looks a little strange. How can we make the following graphics, starting from period 0 ?