Dear professor, untitled.fig (135.4 KB)
Below attachment is my IRF figures. But as you see, they are in wave shape. I have found the reason. Because the reation coefficients in monetary policy is too large, which induce a large fluctuation of variables. But they are optimal. So I want to ask, Can I put these figures into my paper???
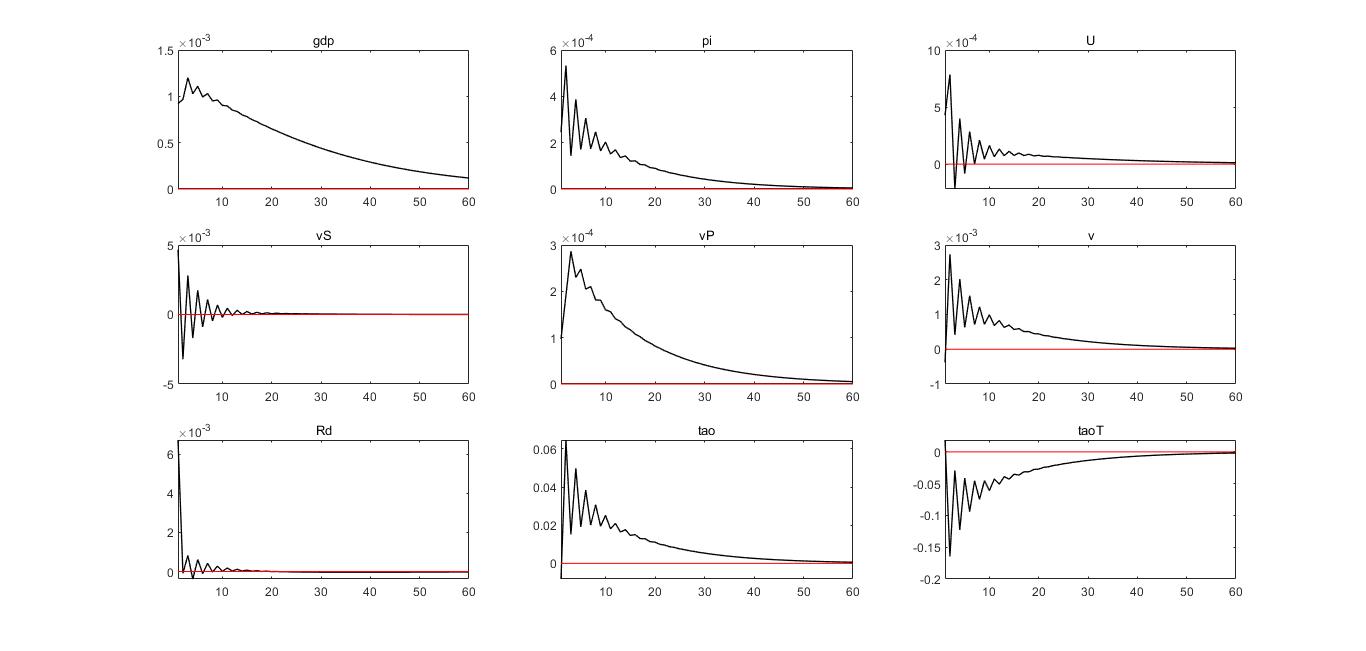
No, these figures clearly indicate a problem in your model and typically stem from a timing error.
Thanks very much, professor jpfeifer. I have found the problem as you said and correct them.