May I kindly ask about the correlation between components of GDP (simulated in Dynare).
For a simple model with equilibrium condition, Y = C + I + G (and even for complex models), one can deduce from the IRFs whether the simulated series (C, I, G) will be procyclical or countercyclical (with respect to output). However, I have not been able to do the same for correlations between the components of Y (i.e., C, I, G).
Sometimes simulated C and I are both procyclical (with respect to output) but the correlation between C and I is either positive or negative.
Actually, this also true in actual data. For some economies, there is a positive co-movement between C and I, with both C and I being procyclical (with respect to output). In other economies, there is a negative correlation between C and I, although C and I are both procyclical.
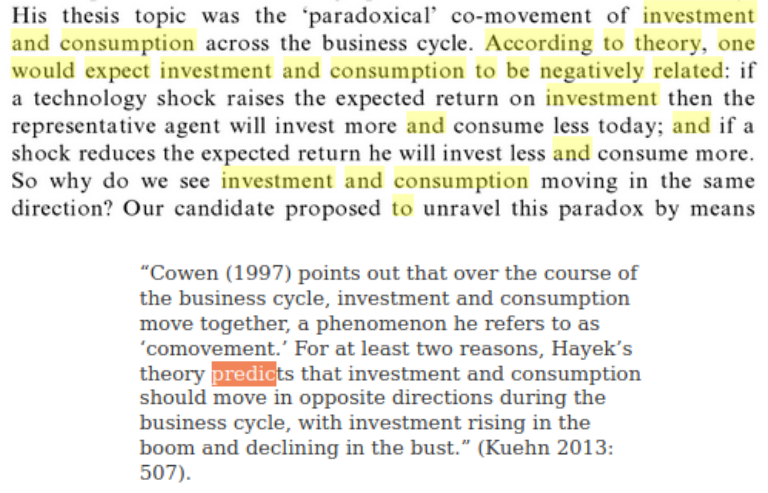
Jespersen & Madsen (2013) have called the correlation between C and I (which can go either ways in actual data) a paradox since theory predicts that C and I should move in opposite directions.
Is this paradox somehow embedded in dynare such that correlation between, for example, simulated C and I is arbitrary, and hence can either be negative or positive?
My instinct tells me it is not arbitrary, but I have not been able to see that from other parts or other results of the model.
Any help to clarify this is very well appreciated. Many thanks!!!
Thanks, Prof. Pfeifer for the reply. The theory that postulates a negative correlation between C and I over the business cycle seems to be Hayek’s theory (I will read more about it later). But in actual data, they could move either way, and so as in dynare. However, I have not been able to explain why the correlation is either negative or positive in dynare. This also applies to all other correlations except correlations between Y and other variables (i.e., first row or first column of correlation block of dynare’s output). For correlation between Y and other variables, I can see that from the IRFs.
Now I am confused. This is a statement about theory, not actual data. There is a variety of shocks that result in a different responses of output and consumption. For a TFP shock, you get comovement between C and I. For financial shocks, that is often not the case. So where is your problem?
Sorry for getting you confused, but I think I understand now.
My problem was that in one mod file, Dynare reports a negative correlation between C and I. And in another mod file, it reports a positive correlation.
There are different shocks in the two mod files though (more than one shock actually). So then, the correlation between C and I could go either way depending on the nature of the shocks in the model, if I get you right.
So, for example, if you have both TFP shock and financial shock in the model, then the correlation between C and I could either be negative or positive.
I also observe this in actual data. Positive correlation between C and I for US data. And negative correlation between C and I for Ghana’s data over the business cycle. I wanted to explain this. So I guess I will have to do that from a theoretical perspective.
But on why dynare also has this property, I think I understand now, that it depends on the nature of shocks in the model. Many thanks for your time. I really appreciate it!!!