In business cycle accounting, the simulated data (counterfactuals) can deviate from observed data quite strongly.
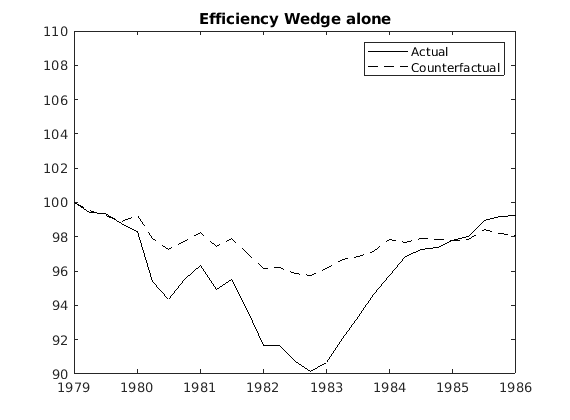
Is that the reason why researchers usually normalize simulated and observed data, for example, to 100, for the start of a given episode? For example, 1979 = 100. I understand that we can normalize if we are concerned about studying short-run dynamics.
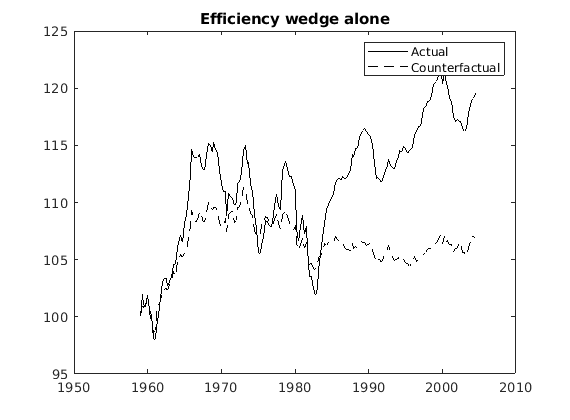
My question: So like the big gap between simulated and actual data in the first plot (in the 2nd half of the sample) is sort of meaningless, yeah? Thus, because we have linearly detrended the data, by assumption, that gap should not exist in theory, and it has no meaning, I guess. Or I am wrong? Because no one has tried to explain it in the BCA literature.
And I guess it is also true for all counterfactual analyses that compare simulated data to actual data, yeah? For example, using simult_().