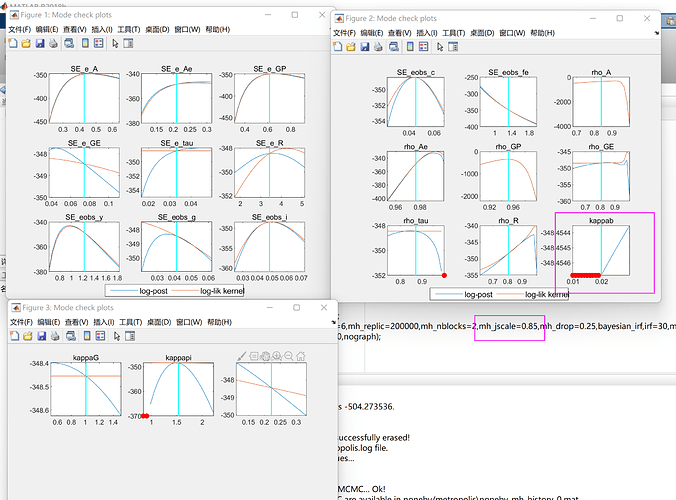
Hello dear professor, I have always been a little confused about Mode check plots, is such a graph considered acceptable? How can I tell if this Mode check plots passes or not? Big red dots indicate parameter values for which the model could not be solved due to e.g. violations of the Blanchard-Kahn
conditions,so there’s a big red dot, isn’t it? Do I need to rescale the mh_jscale?
No, these plots do not look good. A couple of things:
- Some of the likelihood kernel lines are completely horizontal. That typically indicates an identification problem.
- Some of the detected modes are not at the peaks of the posterior kernel.
- Having red dots in the parameter space is not unusual, but it’s problematic if the cause a corner solution instead of an interior solution.
Well received, thank you very much
Dear Prof. Pfeifer,
You mentioned that " Having red dots in the parameter space is not unusual, but it’s problematic if the cause a corner solution instead of an interior solution." Does “corner solution” mean the estimated parameters are close to the boundary? how close is too close? For example, if the persistent in the AR(1) shock is equal to 0.99, does this mean a corner solution?
Thank you,
Alex
Yes, solutions right at the boundary. For AR coefficients, that usually means more like 0.999 than 0.99.
Thank you Prof, Pfeifer for answering my question. I really appreciate it.
